


Introduction
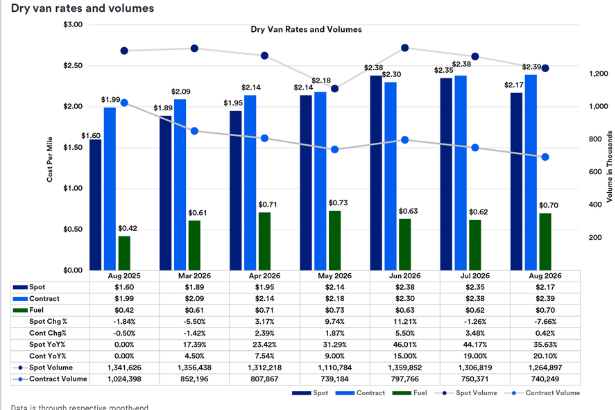
U.S. freight rates are moving in two different directions. The latest U.S. Bank Freight Payment Index, produced in collaboration with DAT Freight & Analytics, shows dry van contract rates rising from $2.30 per mile in June to $2.39 in August, while spot rates fell from $2.38 to $2.17 over the same period.
That divergence is becoming one of the most important signals in the U.S. trucking market.
On the surface, falling spot rates could suggest that transportation is becoming cheaper. But the latest data tells a more complicated story. Fuel surcharges increased from $0.62 to $0.70 per mile between June and August, meaning carriers and shippers were dealing with higher fuel-related costs even as spot linehaul prices softened.
Background and Context
The U.S. Bank Freight Payment Index has tracked freight-payment activity since 2017. In January 2026, U.S. Bank and DAT introduced the Rates Edition, adding quarterly data on contract, spot and fuel rates to the bank’s broader freight-payment research.
The distinction between spot and contract freight is important.
Spot rates are negotiated for individual shipments, generally through brokers and load marketplaces. They can react quickly to changes in available capacity, freight demand, fuel costs and seasonal conditions.
Contract rates, by contrast, are negotiated between shippers and carriers or brokers for ongoing transportation commitments. They tend to adjust more slowly because they are tied to longer-term commercial agreements.
That means the two markets can move in opposite directions for a period of time.
The latest data provides a clear example.
Latest Update: U.S. Freight Rates Move in Opposite Directions
The latest quarterly U.S. Bank/DAT report, released October 1, examines the period from June through August 2026.
The numbers show a widening gap between dry van contract and spot pricing:
| Month | Dry Van Spot Rate | Dry Van Contract Rate | Contract Premium |
|---|---|---|---|
| June 2026 | $2.38/mile | $2.30/mile | Spot higher by $0.08 |
| July 2026 | $2.35/mile | $2.38/mile | Contract higher by $0.03 |
| August 2026 | $2.17/mile | $2.39/mile | Contract higher by $0.22 |
By August, contract freight was approximately 22 cents per mile more expensive than spot freight.
That represents a dramatic change from June, when spot freight was actually priced above the contract rate.
Dry Van Spot Rates Fall
The $2.17-per-mile August spot rate represents a significant decline from June’s $2.38.
DAT’s separate August market report provides additional context. Its national average dry van spot linehaul rate fell 20 cents to $2.19 per mile in August, the steepest July-to-August decline in DAT’s 16-year history for that equipment type.
DAT reported similarly sharp August declines for refrigerated and flatbed equipment:
- Dry van: $2.19 per mile, down 8.4%
- Reefer: $2.61 per mile, down 5.1%
- Flatbed: $2.70 per mile, down 6.9%
Each represented the largest July-to-August decline recorded by DAT for that equipment type.
DAT also noted that August declines are normally seasonal. Spot rates have fallen from July to August in 13 or 14 of the previous 16 years, depending on equipment type.
This year’s decline was simply much larger than the historical pattern.
Contract Rates Keep Climbing
While spot prices were falling, dry van contract rates moved in the opposite direction.
Contract pricing increased:
$2.30 in June → $2.38 in July → $2.39 in August
That left contract freight approximately 22 cents per mile above the August spot rate.
The difference matters for shippers because contract transportation is often used to provide predictable capacity and service levels.
A shipper that committed to contract capacity may therefore be paying substantially more than a shipper purchasing equivalent transportation on the spot market.
However, the comparison is not simply about finding the cheaper number.
Contract and spot freight have different commercial structures, service expectations and capacity considerations.
Fuel Costs Are Changing the Equation
The biggest complication in the latest U.S. freight rates data is fuel.
The U.S. Bank/DAT report found average dry van fuel surcharge rates increased from:
$0.62 per mile in June → $0.70 per mile in August.
That means transportation costs were rising in one component of the freight bill even while spot linehaul pricing was declining.
DAT’s August report similarly found that van fuel surcharges increased by 8 cents to 70 cents per mile. Reefer surcharges reached 77 cents, while flatbed surcharges rose to 84 cents.
This distinction is important because a linehaul rate does not necessarily represent the complete cost of moving a load.
Fuel Accounted for a Larger Share of Spot Freight
According to the U.S. Bank/DAT report, fuel represented approximately 21% of the per-mile broker-to-shipper spot rate on dry van loads in June.
By August, that share had increased to approximately 24%.
That shift helps explain why falling spot linehaul rates do not automatically translate into equivalent reductions in total transportation costs.
Expert Insights or Analysis
The latest numbers suggest the U.S. trucking market is undergoing a complicated adjustment rather than moving uniformly in one direction.
U.S. Bank’s Jeff Pape said rising fuel costs combined with softer linehaul pricing make it important for transportation teams to examine the individual components of freight spending.
DAT’s Patrick Pretorius offered another explanation: higher fuel costs can put additional pressure on smaller, thinner-margin carriers, while the driver pool is already shrinking.
The implication is that today’s lower spot price does not necessarily tell shippers what the market will look like several months from now.
There is another important data point.
DAT reported that dry van and reefer spot rates fell below contract rates again in August after temporarily exceeding contract rates in June and July. For dry vans, August spot rates averaged $2.19 compared with $2.41 for contract freight in DAT’s broader equipment-level data.
The U.S. Bank/DAT Rates Edition uses a different methodology and reported $2.17 spot versus $2.39 contract for August. The figures should therefore be read as complementary measures rather than identical datasets.
Both point to the same broad pattern: spot rates weakened sharply while contract pricing remained elevated.
Broader Implications for U.S. Logistics
The divergence has practical consequences for transportation procurement.
For companies that primarily use contract transportation, the latest numbers suggest they may continue to face elevated contracted rates even while spot-market prices are lower.
For companies that rely heavily on the spot market, today’s lower linehaul costs may provide some relief, but fuel remains a significant variable.
That creates a difficult planning environment.
Transportation managers need to consider:
- Contract-versus-spot exposure
- Fuel surcharge structures
- Carrier capacity
- Shipment consolidation
- Network design
- Lane-level pricing
- Seasonal demand
- Empty-mile exposure
- Service requirements
The U.S. Bank/DAT report specifically points transportation teams toward consolidation and network planning as ways to manage the changing market.
For The Tech Marketer, this story can naturally connect to an internal U.S. logistics and supply-chain analysis hub covering freight technology, transportation management systems, warehousing and procurement.
What the August Spot Rate Decline Tells Us
DAT’s August report offers an important warning against interpreting the spot-rate decline as a simple collapse in freight demand.
DAT said seasonal factors contributed to the decline, including freight that shippers had pulled forward earlier in the summer.
Truckload volumes also declined across all three major equipment types:
| Equipment | August Volume Change vs. July | Year-over-Year Change |
|---|---|---|
| Van | -5% | Approximately flat |
| Reefer | -2% | -10% |
| Flatbed | -3% | -5% |
That suggests the August spot-rate decline was accompanied by softer load activity.
But the market was not simply flooded with excess capacity.
DAT said truck capacity tightened significantly during CVSA Brake Safety Week, yet rates continued to ease. The company interpreted that combination as evidence of cooler demand for trucks around the end of August and Labor Day.
Related History or Comparable Freight Markets
The current divergence follows a period in which spot and contract pricing had been moving closer together.
Earlier in 2026, U.S. Bank and DAT reported that spot rates had been recovering from late-2025 lows while contract rates remained comparatively stable.
In February, the spot rate averaged $2.01 per mile, up from $1.65 in November, while contract pricing reached $2.12.
By March, the gap between the two markets had narrowed substantially.
The first-quarter U.S. Bank Freight Payment Index also found that spot rates increased faster than contract rates as trucking capacity tightened. The quarterly spot average rose 11.9% from the previous quarter.
The market then moved through another phase during the summer, when spot rates temporarily exceeded contract rates in June and July before falling below them again in August.
That sequence illustrates how quickly trucking pricing can change.
What Happens Next
The key question for transportation managers is whether the August spot-rate decline represents a temporary seasonal adjustment or a more durable shift in freight demand.
The latest data alone cannot answer that question.
Several indicators will be important to watch through the fall:
1. Spot Rates
If spot rates stabilize or begin rising again, the August decline could prove largely seasonal.
If they continue falling, it would provide stronger evidence of sustained softness in transactional freight demand.
2. Contract Pricing
Contract rates remain elevated relative to spot prices.
The next reports will show whether contract pricing begins to follow spot rates downward or remains supported by longer-term capacity agreements.
3. Diesel Costs
Fuel is becoming an increasingly important component of the freight bill.
U.S. Bank/DAT data showed fuel surcharges rising from 62 cents to 70 cents per mile between June and August.
4. Carrier Capacity
Carrier exits, equipment utilization and driver availability will influence how quickly the market can tighten again.
5. Freight Volumes
Load volumes will be especially important because the August spot-rate decline occurred alongside lower truckload volumes.
What This Means for Shippers
The latest U.S. freight rates data does not point to a single market condition.
Instead, it shows a split between different parts of the trucking market.
A shipper negotiating long-term contracts is facing a different pricing environment from one buying transportation load by load.
That makes procurement strategy more important.
Companies may want to examine whether their current transportation mix matches their actual network requirements rather than focusing exclusively on the headline rate per mile.
The U.S. Bank/DAT findings specifically point toward consolidation and network planning as areas transportation teams can examine as fuel costs rise and pricing structures diverge.
Conclusion
The latest U.S. freight rates data presents a market moving in two directions at once.
Dry van contract rates climbed from $2.30 per mile in June to $2.39 in August, while spot rates fell from $2.38 to $2.17 over the same period. Fuel surcharges increased from $0.62 to $0.70 per mile, adding cost pressure despite softer spot linehaul pricing.
DAT’s separate August report reinforces the trend, showing record July-to-August spot-rate declines across dry van, reefer and flatbed equipment.
The result is a freight market that cannot be understood through a single rate.
Spot pricing, contract commitments, fuel costs, carrier capacity and shipment volumes are telling different parts of the story.
For U.S. shippers and logistics teams, that makes the next several months particularly important for transportation budgeting, network planning and contract strategy.
FAQ
What are U.S. freight rates doing in 2026?
The latest U.S. Bank/DAT data shows contract and spot truck freight rates moving in different directions. Dry van contract rates rose to $2.39 per mile in August, while spot rates fell to $2.17.
Why are U.S. freight rates moving differently between spot and contract markets?
Spot and contract freight operate under different pricing structures. Spot rates can react quickly to changes in demand and capacity, while contract rates are negotiated for ongoing transportation commitments and can adjust more slowly.
How much did dry van spot rates fall in August?
DAT reported that its national average dry van spot linehaul rate fell 20 cents, or 8.4%, to $2.19 per mile in August. It described the decline as the largest July-to-August drop in its 16-year history for dry van rates.
What happened to contract truck freight rates?
The U.S. Bank/DAT Rates Edition reported dry van contract rates rising from $2.30 per mile in June to $2.38 in July and $2.39 in August.
Are fuel costs affecting U.S. trucking rates?
Yes. Average dry van fuel surcharge rates increased from $0.62 per mile in June to $0.70 in August, according to U.S. Bank/DAT.
Are lower spot rates good news for shippers?
Lower spot rates can reduce costs for shippers purchasing transportation in the spot market, but the overall impact depends on fuel costs, shipment volumes, contract commitments and available carrier capacity.
What should logistics managers watch next?
The most important indicators are spot-rate direction, contract-rate changes, diesel costs, carrier capacity and truckload volumes. Together, they provide a more complete picture than any single freight-rate measure.
Sources & References
- “U.S. Bank and DAT: Contract and spot truck freight rates diverge,” U.S. Bank/DAT, October 1, 2026. Read the latest U.S. Bank/DAT freight-rate report
- “DAT: Spot van rate falls 20 cents in steepest August pullback on record,” DAT Freight & Analytics, September 15, 2026. Read DAT’s August rate analysis
- “U.S. Bank Freight Payment Index: Shippers pay more as trucking capacity tightens,” U.S. Bank, 2026. Read U.S. Bank’s freight-spending analysis
- “U.S. Bank and DAT: Truck freight rates show modest uptick in early 2026,” U.S. Bank, April 1, 2026. Read the earlier 2026 freight-rate report