


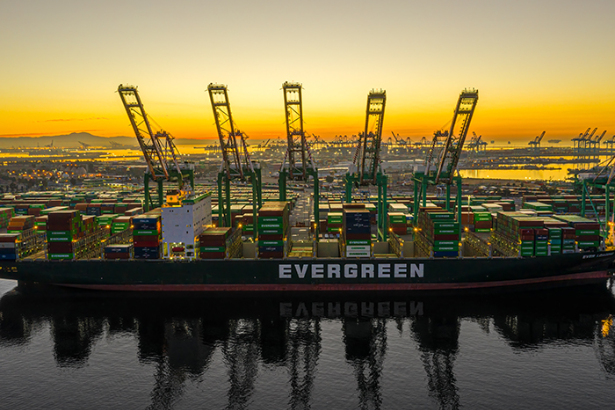
U.S. ocean container imports reached a September record in 2026, with 2.55 million TEUs moving through the country’s maritime gateways. The surge was led by a 21.2% jump in China-origin shipments, offering a fresh snapshot of consumer demand, retail inventory and the increasingly complicated U.S. trade environment.
Introduction
U.S. container imports hit a new September record in 2026, rising 10.3% from a year earlier to 2.55 million twenty-foot equivalent units, or TEUs.
The jump is notable not simply because of the size of the number. It also comes against a backdrop of shifting trade policy, changing sourcing strategies and persistent uncertainty across global shipping routes.
According to data from Descartes Systems Group reported by Reuters, imports from China increased 21.2%, reaching 924,454 TEUs in September. Chinese cargo represented 36.3% of total U.S. container import volume for the month. Reuters
That makes September’s numbers an important signal for the U.S. supply chain.
More containers entering the country generally mean more merchandise moving through ports, rail networks, trucking systems, warehouses and distribution centers.
But record imports do not automatically mean the economy is booming.
The real story is in what is arriving, where it is coming from and why companies are moving it now.
Background and Context
Containerized imports are one of the clearest ways to watch the physical side of the U.S. economy.
A TEU represents the capacity of a standard 20-foot shipping container. The measure allows ports, carriers, logistics companies and analysts to compare cargo volumes even when shipments arrive in containers of different sizes.
When U.S. container volumes rise, the effects can spread across the logistics network.
Cargo unloaded at a port may move by:
- Truck
- Rail
- Intermodal transportation
- Warehousing networks
- Distribution centers
- Last-mile delivery systems
That means a change in ocean imports can eventually affect trucking demand, warehouse utilization, inventory levels and retail availability.
The latest numbers are particularly interesting because August was already unusually strong.
Descartes reported that August U.S. container imports reached 2.60 million TEUs, the third-highest monthly level on record at that point. August imports were up 3.8% from July and 3.3% year over year. Descartes
September then produced another strong result, although the month-to-month comparison should be treated carefully because seasonal shipping patterns can significantly influence monthly volumes.
Latest Update: U.S. Container Imports Reach 2.55 Million TEUs
The headline number is 2.55 million TEUs.
Reuters reports that September imports increased 10.3% compared with September 2025, establishing a new record for the month. Reuters
Read the Reuters report on the September import record
The increase was heavily influenced by China.
China-origin shipments reached 924,454 TEUs, up 21.2% from a year earlier. That means more than one-third of all U.S. container imports in September came from China. Investing.com
The composition of those shipments is also revealing.
Reuters reports that several categories of goods sold by major U.S. retailers, including Walmart and Costco, were prominent in the China-origin shipments. Those categories included:
- Plastic products
- Furniture and bedding
- Toys
- Sporting goods Investing.com
This is important because it connects port activity with the consumer economy.
These are not abstract industrial components. They include products that eventually appear in stores, warehouses and e-commerce fulfillment networks.
The nine-month picture is more moderate
The September surge should not be interpreted as proof that U.S. imports have been accelerating throughout the entire year.
Reuters reports that total U.S. container import volume for the first nine months of 2026 was up only 0.8% from the same period in 2025. Yahoo Finance
That is a much more restrained picture than September’s 10.3% year-over-year increase.
In other words, September was exceptionally strong, but the year-to-date picture remains relatively modest.
That distinction matters for supply-chain executives trying to determine whether the latest increase represents a temporary shipping surge or a sustained change in demand.
China Is Still Central to the U.S. Import Network
The most striking feature of the September data is the rebound in China-origin cargo.
Chinese shipments accounted for 36.3% of total U.S. container imports during the month. Investing.com
That is significant because companies have spent years discussing diversification away from China.
Manufacturers and retailers have increasingly explored alternative sourcing locations, including Vietnam, Thailand, India, Mexico and other markets.
Yet the latest data demonstrates how difficult it can be to rapidly replace China’s enormous manufacturing ecosystem.
China’s importance is not based on one product category.
Its industrial base spans plastics, furniture, electronics, machinery, consumer goods, toys, textiles and thousands of intermediate products.
That breadth makes supply-chain diversification a gradual process rather than a simple switch from one country to another.
Descartes’ August data showed China-origin imports at 884,318 TEUs, representing 34% of total U.S. container imports for that month. Descartes
September’s 924,454 TEUs therefore represented another substantial increase.
What the Import Surge Says About Retail
The product mix provides another clue.
Furniture, bedding, plastics, toys and sporting goods are closely connected to consumer spending and retail inventory.
That makes the September numbers particularly relevant as U.S. retailers move through the second half of the year.
Retailers typically need inventory in place well before consumers purchase it.
A toy arriving at a U.S. port in September may have been ordered months earlier. It can then move to a distribution center, sit in inventory and eventually reach a store or e-commerce customer during the holiday shopping period.
The shipping data therefore does not provide a perfect real-time measure of consumer demand.
Instead, it offers a window into what companies expected consumers to buy when those orders were placed.
That distinction is critical.
High imports can reflect strong consumer expectations, inventory rebuilding, tariff timing, seasonal preparation or companies trying to get goods into the country before costs or regulations change.
Often, several of those forces operate simultaneously.
Expert Insights and Analysis
The biggest mistake would be to treat the September record as a simple “U.S. consumers are buying more” story.
The data is more complicated.
Import volume reflects decisions made by manufacturers, retailers, distributors and logistics companies months before cargo reaches a U.S. port.
Companies may accelerate shipments because they expect:
- Higher tariffs
- Higher freight rates
- Higher fuel costs
- Port disruptions
- Geopolitical instability
- Seasonal demand
- Changes in sourcing costs
Reuters previously reported that the Port of Los Angeles experienced unusually high volumes during June, July and August as retailers accelerated shipments of holiday merchandise amid concerns about tariffs and higher fuel costs. Reuters
That context is important when interpreting September.
A portion of today’s import activity can represent risk management rather than pure demand growth.
Companies may be choosing to move inventory earlier because waiting could be more expensive or less predictable.
Supply chains are increasingly being managed around uncertainty
This is one of the most important changes in modern logistics.
For decades, supply-chain management emphasized efficiency.
Companies tried to minimize inventory, shorten delivery times and reduce transportation costs.
The pandemic demonstrated the downside of extreme optimization.
Today, many companies are balancing efficiency against resilience.
That can mean carrying additional inventory, maintaining multiple suppliers, booking transportation earlier or shifting cargo between ports.
The September import record fits into that broader evolution.
Broader Implications
1. Ports could face continued pressure
More containers eventually mean more work for ports, truckers, rail operators and warehouses.
The impact is not necessarily immediate congestion.
A port can process record volumes efficiently if vessel schedules, terminal capacity, labor availability, chassis supply, rail service and trucking capacity all remain aligned.
But when several of those systems become constrained at the same time, delays can spread quickly.
Descartes reported in its August analysis that port transit delays were increasing across major U.S. gateways while import volumes remained elevated. Descartes
That combination deserves attention.
2. Warehouses need to absorb the inventory
The container is only the beginning of the journey.
Once cargo leaves a port, it needs somewhere to go.
That means strong import volumes can increase demand for:
- Distribution centers
- Warehousing
- Inventory management
- Drayage
- Rail transportation
- Long-haul trucking
- Fulfillment services
The supply chain therefore behaves like a connected system.
A record at the port can become a capacity challenge at a warehouse several hundred miles inland.
3. China remains difficult to replace
The September numbers also challenge the assumption that U.S. importers can quickly reduce their dependence on China.
Diversification is happening, but China’s scale remains difficult to replicate.
Even as companies build alternative sourcing relationships, Chinese manufacturing continues to supply enormous quantities of finished products and components.
That means future U.S. trade patterns are likely to involve a combination of China, Southeast Asia, Mexico, India and other manufacturing centers rather than a simple China-to-somewhere-else transition.
4. Trade policy continues to influence logistics decisions
Trade policy is increasingly becoming an operational variable.
A tariff announcement can change the economics of an order.
That can influence:
- When a shipment leaves Asia
- Which port receives it
- How much inventory a retailer holds
- Which country supplies the product
- Whether a company uses air freight or ocean freight
- Whether an importer accelerates or delays purchasing
The September numbers therefore provide more than a snapshot of shipping activity.
They offer evidence of how businesses are adapting to an uncertain trade environment.
For more coverage of logistics technology, global trade and supply-chain transformation, an internal link to The Tech Marketer would fit naturally here.
Related History and Comparable Trends
The U.S. container market has experienced several extraordinary periods during the past decade.
The COVID-era shipping boom produced unprecedented container volumes and severe congestion at major U.S. ports.
Later, as retailers worked through excess inventory and consumer spending shifted toward services, container volumes declined.
The market then became increasingly sensitive to tariffs and geopolitical disruptions.
Descartes’ historical data shows just how unusual recent volumes have been. August 2026 reached 2.60 million TEUs, while the company continues to track monthly import levels against the previous records established during the pandemic-era surge. Descartes
The current market is therefore not simply returning to the old pre-pandemic model.
Companies have learned to respond much faster to changes in freight costs, trade rules and geopolitical risk.
That makes shipping data more strategically important than it once was.
What Happens Next
The next question is whether September’s record will be followed by another strong import period or whether volumes will moderate.
Several indicators will matter.
Retail inventory
If retailers already have enough holiday merchandise in U.S. warehouses, imports could slow.
If companies continue replenishing inventory, container volumes could remain elevated.
China-origin shipments
China’s September increase is particularly important.
If the 21.2% year-over-year increase continues, it would suggest that Chinese manufacturing remains a major driver of U.S. import activity despite diversification efforts.
Port capacity
Sustained high volumes would increase pressure on major gateways and inland transportation networks.
Freight rates
Ocean carriers will closely watch demand because sustained cargo growth can influence vessel utilization and freight pricing.
Trade policy
Changes in tariffs and other trade rules could alter shipping patterns quickly.
That makes the next several months important for retailers, manufacturers and logistics providers planning their 2027 sourcing strategies.
Conclusion
The September U.S. container imports record is a powerful snapshot of the American supply chain at a complicated moment.
The country imported 2.55 million TEUs in September, up 10.3% from a year earlier and the highest September volume on record. China accounted for 924,454 TEUs, with China-origin shipments rising 21.2% year over year. Reuters
But the numbers should not be reduced to a simple story about booming consumer demand.
The nine-month total was up only 0.8% from 2025, while the composition of imports suggests that retailers and other companies are actively managing inventory and sourcing decisions. Yahoo Finance
The bigger story is resilience.
U.S. companies are operating supply chains in an environment where tariffs, freight costs, geopolitical events and consumer demand can change the economics of a shipment very quickly.
That makes every container more than a box of merchandise.
It is a decision about where products are made, when they move, how much inventory companies hold and how businesses manage risk.
September’s record shows that, despite all the talk about reshoring and supply-chain diversification, the world’s largest consumer market is still pulling enormous volumes of goods through its ocean gateways.
And China remains at the center of that flow.
FAQ
What are U.S. container imports?
U.S. container imports are goods arriving in the United States by ocean freight in standardized shipping containers. Volumes are commonly measured in twenty-foot equivalent units, or TEUs.
How many containers did the U.S. import in September 2026?
U.S. ocean container imports reached approximately 2.55 million TEUs in September 2026, according to Descartes data reported by Reuters. That was a September record and represented a 10.3% increase from September 2025. Reuters
How much did U.S. imports from China increase?
China-origin U.S. container imports increased 21.2% year over year in September to 924,454 TEUs. China accounted for 36.3% of total U.S. container import volume during the month. Investing.com
Does the September import record mean U.S. consumer demand is booming?
Not necessarily. Import volumes can reflect consumer demand, but they can also be influenced by seasonal inventory planning, tariff expectations, freight costs and companies moving goods earlier to reduce supply-chain risk.
What products are arriving from China?
Reuters reports that major categories included plastic goods, furniture and bedding, toys and sporting goods, including products sold by major U.S. retailers such as Walmart and Costco. Investing.com
Are U.S. companies reducing their dependence on China?
Many companies have pursued sourcing diversification, but the September data shows China remains a major source of U.S. containerized imports. Replacing China’s manufacturing ecosystem is a gradual process because of its scale and broad industrial base.
What does a record in U.S. container imports mean for ports?
Sustained high import volumes can increase demand for port terminals, trucking, rail, warehouses and other logistics services. Whether that creates congestion depends on available capacity throughout the entire transportation network.
Why are U.S. container imports important for the supply chain?
Container imports provide an early view of physical goods moving into the U.S. economy. Changes in import volume can affect ports, freight carriers, warehouses, retailers, manufacturers and transportation providers.
Sources & References
- Reuters, “US ocean container imports set new record for September, Descartes says”
Read the Reuters report - Descartes Systems Group, “The Global Logistics Shipping Resource Center”
Read the Descartes shipping data - Descartes Systems Group, “August U.S. Container Imports Reach Third-Highest Level on Record Amid Rising Port Delays and Trade Risks”
Read the Descartes analysis - Reuters, “Busiest US seaport set new three-month volume record after early holiday import rush to avoid new tariffs, higher fuel costs”
Read the Reuters port analysis