


Introduction
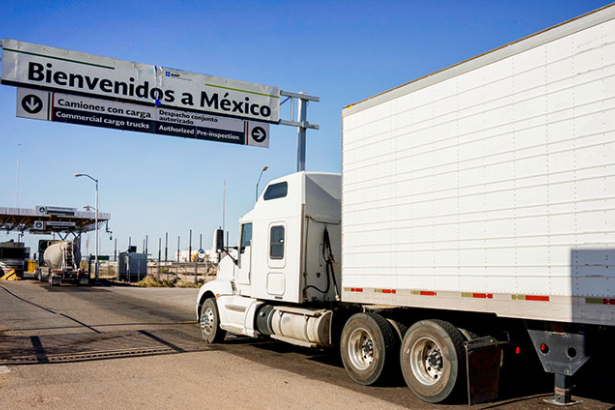
Cross-border freight is becoming an increasingly important part of North American logistics as manufacturers, distributors, and retailers rethink how goods move between the United States, Canada, and Mexico.
Recent transportation data points to a notable shift. According to an August 2026 industry analysis published by Wicker Park Logistics, truck freight between the three countries increased 23% year over year in June. Freight moving between the United States and Canada grew 17%, while U.S.-Mexico truck freight increased 22.2%. The figures are based on data attributed to the Bureau of Transportation Statistics.
The growth comes against a complicated backdrop. Domestic freight volumes have remained uneven, transportation costs have faced upward pressure, and changing trade policies have encouraged businesses to reconsider sourcing and distribution strategies.
For logistics managers, these developments create both opportunities and challenges.
Manufacturers may be able to shorten supply lines by sourcing more components from neighboring countries. Importers can explore alternative transportation routes, while distributors may gain access to additional suppliers and production capacity.
However, increased cross-border activity also introduces operational requirements. Customs documentation, carrier coordination, delivery scheduling, border delays, and changing transportation rates can all affect the reliability of a shipment.
The important question is no longer simply whether cross-border freight is growing. Businesses need to understand why that growth is happening, where the opportunities exist, and how to build transportation networks that can handle changing demand.
Background and Context: Understanding Cross-Border Freight
Cross-border freight refers to goods transported between countries. In North America, the term commonly describes shipments moving between the United States, Canada, and Mexico.
These movements support a wide range of industries, including automotive manufacturing, industrial machinery, food and beverage production, consumer goods, agriculture, and electronics.
A product manufactured in one country may require components from another, pass through a distribution facility in a third location, and ultimately reach customers across multiple markets.
This interconnected system makes transportation reliability a central part of business operations.
Why the U.S., Canada, and Mexico matter
The three countries share extensive commercial relationships and established road, rail, and border infrastructure.
For many businesses, geographic proximity makes North American suppliers attractive compared with suppliers located farther overseas.
Shorter transportation distances can help companies reduce transit times, improve inventory visibility, and respond more quickly to changes in customer demand.
However, proximity does not automatically guarantee lower costs. The final economics depend on production expenses, labor availability, transportation rates, tariffs, customs requirements, and the reliability of individual shipping routes.
A company evaluating a new supplier should therefore examine the entire supply chain rather than focusing only on the distance between the factory and the customer.
What is nearshoring?
Nearshoring involves moving production or sourcing activities closer to the market being served.
For U.S. businesses, this can mean shifting some manufacturing activity from distant overseas locations to Mexico or other nearby markets.
The strategy can offer several advantages:
- Shorter replenishment cycles.
- More frequent communication with suppliers.
- Reduced exposure to certain long-distance shipping disruptions.
- Greater flexibility when adjusting production schedules.
- Improved coordination between manufacturing and distribution teams.
Nearshoring does not eliminate international transportation requirements. Instead, it changes where goods originate and how they move through the supply chain.
Wicker Park Logistics identifies nearshoring as a possible contributor to the longer-term growth of U.S.-Mexico truck freight.
Latest Update: Cross-Border Truck Freight Increased in June 2026
The latest figures highlighted in the Wicker Park Logistics report suggest that North American truck freight is following a different trajectory from parts of the domestic freight market.
U.S.-Mexico freight shows strong growth
According to the report, truck freight moving between the United States and Mexico increased 22.2% year over year in June 2026. The report also notes that Laredo, Texas, was the leading port by freight value during the month, representing $35.6 billion in freight.
Laredo’s importance reflects its role as a major gateway for trade between the two countries.
For companies moving industrial components, automotive parts, machinery, and other manufactured goods, border crossings can form a critical link between production facilities and U.S. distribution networks.
As cross-border volumes grow, transportation planning becomes more important. Shippers must coordinate pickup schedules, documentation, customs clearance, carrier availability, and final delivery appointments.
A shipment can leave the manufacturing facility on schedule and still arrive late if another stage of the process creates a bottleneck.
U.S.-Canada freight is also expanding
The same report states that U.S.-Canada truck freight increased 17% compared with June 2025.
Canada remains an important trading partner for U.S. manufacturers, distributors, and retailers.
Cross-border shipments support industries ranging from industrial equipment and automotive production to agricultural goods and consumer products.
Businesses operating across the northern border must account for customs procedures, applicable trade rules, carrier requirements, and seasonal transportation conditions.
The growth reported in June suggests that companies should continue monitoring capacity, rates, and service reliability on important Canada-bound and Canada-originating routes.
It does not, by itself, establish that every industry or shipping lane is experiencing the same level of growth.
Cross-border growth contrasts with weaker domestic freight demand
One of the most significant findings is the contrast between international truck freight activity and softer domestic freight indicators.
The Wicker Park Logistics analysis reports that the Cass Freight Index shipments component declined 4.8% year over year in July 2026. It also reports that the Cass expenditures index remained higher year over year, despite a monthly decline.
This combination illustrates why freight demand and transportation spending should not be treated as interchangeable measures.
Shipment volumes can fall while total spending remains elevated if transportation costs increase.
For shippers, that creates a difficult planning environment. Companies may be moving fewer domestic loads while still paying more for certain transportation services.
At the same time, growing cross-border activity may require additional attention to specific routes, border facilities, and international carrier relationships.
The result is a freight market that cannot be understood through a single national volume or pricing indicator.
Expert Analysis: Five Factors Driving Cross-Border Freight
1. Nearshoring is changing transportation networks
Manufacturers increasingly evaluate where production should take place based on more than labor costs alone.
Long-distance supply chains can expose businesses to extended transit times, international shipping disruptions, and inventory uncertainty.
Moving selected production closer to U.S. customers can improve responsiveness, particularly when manufacturers need components frequently or operate with tight production schedules.
Mexico is geographically positioned to support many of these arrangements.
However, nearshoring requires more than relocating a factory. Companies must evaluate supplier capabilities, workforce availability, infrastructure, border procedures, transportation capacity, and the cost of moving goods between production and distribution facilities.
A successful nearshoring strategy therefore depends on designing a transportation network that supports the new manufacturing footprint.
2. Trade policy uncertainty is affecting sourcing decisions
Tariffs and changes in trade policy can alter the economics of sourcing from different countries.
When businesses face uncertainty about future import costs, they may reconsider where they obtain materials, how much inventory they hold, and which routes they use.
Some companies respond by bringing inventory forward ahead of anticipated changes. Others diversify suppliers or investigate alternative production locations.
These decisions can create sudden changes in freight demand.
A lane that was previously predictable may experience a temporary increase in shipments, while another route sees lower volumes as sourcing patterns change.
For logistics managers, the practical response is to monitor trade developments and model multiple scenarios rather than relying on a single forecast.
3. Transportation capacity influences shipping costs
Freight prices depend on more than shipment volume.
Carrier availability, equipment type, fuel expenses, driver supply, route imbalance, and service requirements all influence the rate a shipper receives.
A growing cross-border lane may experience pricing pressure if available capacity cannot keep pace with demand.
Conversely, a route with weaker demand may offer more negotiating flexibility, depending on carrier conditions.
This makes lane-level analysis especially important.
Businesses should compare current quotes with historical pricing, monitor service performance, and evaluate whether a proposed rate includes the services required for the shipment.
The lowest initial quote is not necessarily the least expensive option if it leads to delays, unexpected fees, or additional handling.
4. Intermodal transportation can provide alternatives
Cross-border freight does not always need to move entirely by truck.
Depending on the route, shipment characteristics, delivery requirements, and available infrastructure, rail and intermodal services may offer an alternative.
Intermodal transportation combines multiple modes, commonly using rail for a substantial portion of the journey and trucks for pickup and final delivery.
Potential benefits include improved suitability for certain long-distance shipments and access to rail capacity when trucking conditions become difficult.
However, intermodal is not automatically cheaper or faster.
Shippers must evaluate terminal locations, transfer times, equipment availability, delivery deadlines, and the need for additional coordination.
For some freight, direct trucking remains the better option. For others, a carefully planned intermodal route may provide a useful balance of cost and reliability.
5. Visibility is becoming a competitive advantage
International shipments involve more handoffs and dependencies than a simple domestic movement.
A company may need to coordinate a supplier, a freight broker, a carrier, customs processes, a border crossing, and a receiving facility.
Without clear shipment visibility, a delay at one stage can affect downstream operations before anyone recognizes the problem.
Transportation visibility helps businesses identify shipment status, anticipate exceptions, and communicate realistic delivery expectations.
The most useful systems connect shipment information to operational decisions.
For example, if a load is delayed at a border crossing, the receiving facility may be able to adjust its labor schedule or reschedule a production activity.
Visibility cannot eliminate disruption, but it can reduce the time between identifying a problem and responding to it.
Broader Implications: What Cross-Border Freight Growth Means for U.S. Businesses
Growing cross-border freight activity has implications beyond transportation providers.
Manufacturers, retailers, distributors, and importers must consider how changing trade patterns affect their entire operating model.
Manufacturers need to align production and transportation
A manufacturing facility can only benefit from a nearby supplier if the materials arrive when production requires them.
Businesses should align supplier schedules, transportation bookings, inventory policies, and factory requirements.
That may involve establishing shipment milestones, defining acceptable delivery windows, and creating contingency plans for border delays.
Companies with complex production processes should also identify which materials are essential to uninterrupted operations.
A delay involving a low-priority item may be manageable. A delay involving a component required to complete an entire production batch can have much larger consequences.
Importers should review total landed costs
A supplier’s quoted price is only one part of the cost of acquiring goods.
Companies also need to account for transportation, customs-related charges, duties where applicable, handling, insurance, inventory carrying costs, and the potential expense of delays.
A sourcing change that reduces the purchase price may still increase total costs if it introduces longer transit times or additional handling.
Comparing total landed cost across sourcing locations gives decision-makers a more accurate basis for choosing suppliers.
Distributors need more flexible capacity planning
Distribution networks must adapt when demand shifts between domestic and international routes.
Companies that depend on a small number of carriers or border gateways may face greater exposure if those resources become constrained.
A more flexible approach can include maintaining relationships with multiple qualified carriers, reviewing alternative routes, and evaluating whether different transportation modes can meet delivery requirements.
The goal is not to eliminate every disruption. It is to avoid relying on a single operating assumption when the market is changing.
For more coverage of freight operations, transportation technology, and supply chain strategy, readers can explore The Tech Marketer.
Related History: How North American Supply Chains Have Evolved
North American manufacturing and transportation networks have developed through decades of cross-border investment, regional specialization, and trade integration.
Automotive manufacturing is one example of how production can be distributed across multiple countries.
Components may be manufactured in one location, assembled in another, and shipped to customers throughout the region.
This arrangement can improve specialization and efficiency, but it also creates dependencies between suppliers, factories, transportation providers, and distribution facilities.
Recent interest in nearshoring reflects a renewed focus on the resilience and responsiveness of these networks.
Rather than relying exclusively on distant suppliers, some businesses are reassessing how much production should take place closer to their primary markets.
The right decision depends on the product, supplier capabilities, trade rules, transportation costs, and the risks a business is trying to manage.
Cross-border freight growth should therefore be understood as part of a broader change in supply chain planning, not simply as a temporary increase in truck movements.
What Happens Next?
Several indicators will help businesses understand whether cross-border growth continues.
Monitor official freight statistics
The Bureau of Transportation Statistics provides data on transborder freight movements between the United States and its North American trading partners.
Companies can use these figures to understand broader trends and compare transportation modes.
However, national data should be combined with lane-specific information before making operational decisions.
Track freight rates and available capacity
Shippers should monitor both contract and spot rates where relevant, alongside carrier availability and service performance.
Changes in pricing can indicate shifts in capacity, demand, fuel expenses, or other operating conditions.
No single indicator explains the entire market, so businesses should compare multiple measures.
Review sourcing and routing scenarios
Manufacturers and importers should evaluate how alternative sourcing locations would affect transportation costs and delivery times.
That analysis should include customs requirements, border infrastructure, supplier reliability, and the possibility of unexpected delays.
Scenario planning helps businesses make decisions before a disruption forces a rushed change.
Invest in transportation visibility
Shipment tracking and exception management can help companies coordinate cross-border operations more effectively.
Businesses should identify the milestones that matter most, establish clear escalation procedures, and ensure that transportation partners communicate delays promptly.
Better visibility is particularly valuable when transportation schedules are linked directly to manufacturing or customer delivery commitments.
Conclusion
Cross-border freight is becoming an increasingly important part of North American logistics as businesses reassess sourcing, manufacturing, and distribution strategies.
The June 2026 figures reported by Wicker Park Logistics show year-over-year growth in truck freight between the United States, Canada, and Mexico, with particularly strong growth on U.S.-Mexico routes. At the same time, the report highlights weaker domestic freight indicators and continued pressure on transportation costs.
For shippers, the lesson is that a growing market does not automatically mean an easier operating environment.
More freight can increase demand for capacity, while trade uncertainty and changing sourcing patterns can make established routes less predictable.
Businesses that monitor lane-level data, compare transportation modes, improve shipment visibility, and evaluate total landed costs will be better positioned to respond.
Cross-border freight growth creates opportunities for companies that can move goods reliably across North America. Capturing those opportunities requires more than finding a truck. It requires a transportation strategy built around the realities of the entire supply chain.
Frequently Asked Questions
1. What is cross-border freight?
Cross-border freight is the transportation of goods between countries. In North America, it commonly refers to shipments moving between the United States, Canada, and Mexico by truck, rail, or other transportation modes.
2. Why is cross-border freight growing?
Potential contributors include nearshoring, regional manufacturing relationships, changing sourcing strategies, and the integration of North American supply chains. The relative importance of each factor varies by industry and route.
3. How much did U.S.-Mexico truck freight grow in June 2026?
Wicker Park Logistics reported that U.S.-Mexico truck freight increased 22.2% year over year in June 2026, based on data attributed to the Bureau of Transportation Statistics.
4. How much did U.S.-Canada truck freight grow?
The same report states that truck freight between the United States and Canada increased 17% compared with June 2025.
5. What is nearshoring in logistics?
Nearshoring involves moving production or sourcing closer to the market being served. For U.S. companies, it can involve shifting selected manufacturing activities to Mexico or other nearby locations.
6. Does cross-border freight growth mean shipping rates will fall?
No. Rates depend on demand, capacity, fuel costs, equipment availability, route conditions, and service requirements. Higher freight volumes can sometimes contribute to upward pricing pressure.
7. What are the main challenges of cross-border shipping?
Common challenges include customs documentation, regulatory compliance, border delays, carrier coordination, changing trade policies, shipment visibility, and transportation cost fluctuations.
8. How can businesses improve cross-border freight efficiency?
Businesses can improve efficiency by planning shipments earlier, selecting suitable carriers, preparing accurate documentation, monitoring delivery milestones, comparing transportation modes, and developing contingency plans for disruptions.
Sources & References
- Wicker Park Logistics, “Cross-Border Freight Sees Nearly 25% Gain.” Published August 27, 2026.
- U.S. Bureau of Transportation Statistics, TransBorder Freight Data.
- Council of Supply Chain Management Professionals, 2026 State of Logistics Report.
- Association of American Railroads, Freight Rail Traffic Reports.
- Cass Information Systems, Cass Freight Index.