


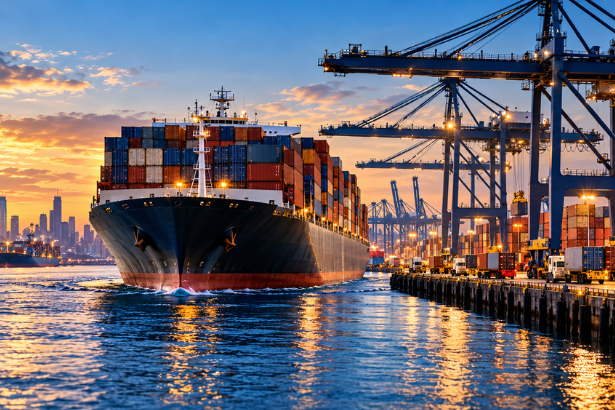
U.S. container imports reached a new September record in 2026, offering a strong signal that American demand for imported goods remains resilient despite trade policy uncertainty and disruptions to global shipping routes. According to the October Global Shipping Report from Descartes Systems Group, the United States imported 2,546,261 twenty-foot equivalent units, or TEUs, during September. That was 10.3% higher than September 2025 and 24.8% above the September 2019 level.
But the record comes with a warning. Port transit delays increased at eight of the ten major U.S. gateways tracked by Descartes. New York and New Jersey recorded the largest increase, while Houston, Oakland and Savannah also experienced longer delays.
For retailers, manufacturers and logistics managers, the combination creates a difficult planning environment. Strong import volumes can support business activity, but longer transit times and changing freight conditions can complicate inventory replenishment, delivery commitments and working-capital management.
The latest numbers tell a story that goes beyond a busy month at American ports. They reveal how demand, international sourcing decisions and shipping reliability are shaping the U.S. supply chain as businesses move deeper into the final quarter of 2026.
Background and Context: Why U.S. Container Imports Matter
Container imports are one of the most useful indicators of activity across the U.S. goods economy. Millions of products enter American ports every year, ranging from furniture, clothing and toys to machinery, electronics and industrial components.
These shipments connect overseas manufacturers with U.S. retailers, distributors, factories and consumers. Changes in import volumes can therefore reveal shifts in demand, inventory planning and sourcing decisions.
A rising import total does not necessarily mean every sector is growing at the same pace. Businesses may increase shipments because consumer demand is strengthening, because they expect future trade costs to rise, or because they need to replenish inventory before a busy sales period.
The September 2026 data captures this complexity.
Descartes reported that U.S. containerized imports declined 2.2% from August, yet remained 10.3% above the same month a year earlier. The September total also stood 24.8% above September 2019, before the pandemic disrupted global trade.
That combination matters. Monthly volumes eased slightly, but the year-over-year comparison showed a substantial increase.
The figures also suggest that businesses are continuing to move goods through international supply chains even as trade regulations, shipping routes and freight costs remain uncertain.
Read the Descartes October 2026 Global Shipping Report for the underlying data.
Latest Update: U.S. Container Imports Reach a September Record
1. Import volumes rise 10.3% year over year
Descartes reported that U.S. container imports totaled 2,546,261 TEUs in September 2026.
The report provides three important comparisons:
- September imports increased 10.3% from September 2025.
- Volumes were 24.8% above September 2019.
- Imports declined 2.2% from August 2026.
The month-over-month decline should not be mistaken for a broad contraction. September volumes still reached the highest level recorded for that month in the Descartes dataset.
The first nine months of 2026 also showed a modest improvement. Cumulative imports were up 0.8% compared with the same period in 2025, marking the first time this year that year-to-date volumes moved ahead of the previous year’s total.
For businesses, the message is mixed but important. Import activity remains strong, although the modest year-to-date increase suggests that the broader trend is less dramatic than the September headline alone might imply.
2. China-origin shipments rebound sharply
China remained the largest source of U.S. container imports in September.
Imports originating in China reached 924,454 TEUs, increasing 4.5% from August and 21.2% from September 2025.
China accounted for 36.3% of total U.S. container imports in September, compared with 34.0% in August.
The largest product categories included plastics, furniture and bedding, and toys and sporting goods. Machinery and electrical machinery also represented a meaningful share of shipments from China.
This increase is significant because businesses have spent recent years reassessing their dependence on Chinese suppliers amid tariffs, geopolitical tensions and supply chain diversification efforts.
The September figures show that diversification does not necessarily mean a rapid reduction in imports from China. Companies may continue relying on established suppliers when production capacity, cost, product specifications and delivery requirements make alternatives difficult to implement.
The data also illustrates why sourcing decisions need to be examined at the product and company level. National import totals cannot establish whether individual businesses are shifting production, building inventory or changing supplier relationships.
3. West Coast ports gain ground
The distribution of imports among U.S. ports changed in September.
According to Descartes, the top five West Coast gateways accounted for 46.7% of total U.S. imports, up 4.4% from August. The top five East and Gulf Coast ports accounted for 39.7%, down 3.2%.
Los Angeles, Long Beach, Oakland and Tacoma all recorded month-over-month increases in import volumes.
Los Angeles imports rose 8.8%, while Long Beach increased 5.9%. Oakland recorded a 14.4% increase, and Tacoma rose 7.0%.
Several East and Gulf Coast gateways moved in the opposite direction. Houston imports fell 16.5%, Savannah declined 9.6%, and the Newark, New Jersey, gateway fell 5.1%.
The pattern indicates that September’s import growth was not evenly distributed across the country.
For shippers, port selection can influence inland transportation costs, warehouse replenishment schedules and the amount of inventory required to protect against delays. A port that performs well for one sourcing route may be less attractive for another because of rail connections, truck availability, destination geography or terminal conditions.
The latest figures reinforce the value of evaluating the full journey from overseas factory to final destination rather than selecting a gateway based on ocean freight rates alone.
4. Port transit delays increase at eight major gateways
The most important operational warning in the October report concerns transit delays.
Descartes reported that delays increased at eight of the ten major U.S. ports tracked. New York and New Jersey experienced the largest increase, with average port transit delays rising 1.5 days to 8.3 days.
Houston’s delays increased 1.4 days to 7.2 days. Oakland rose 0.7 days to 6.4 days, while Savannah increased 0.6 days to 6.7 days.
Seattle was the only gateway in the group to improve, with delays falling by one day to 6.5 days. Long Beach was essentially unchanged.
These measurements require context. Descartes defines port transit delay as the difference between the estimated arrival date initially declared on the bill of lading and the date when the company receives U.S. Customs and Border Protection-processed bill of lading data. The metric is not a direct measurement of how long every container waits at a terminal before being collected.
Nevertheless, it offers a useful indication of changes in the timing of import processing and arrival-related data.
For importers, even a modest increase in expected transit time can affect planning. A retailer waiting for seasonal merchandise may need to revise replenishment schedules, while a manufacturer relying on imported components may need additional buffer stock.
Read the American Journal of Transportation’s coverage of the Descartes report for further details.
Expert Insights and Analysis: Why Record Imports Do Not Guarantee Reliable Supply Chains
The September data highlights a central challenge in international logistics: strong trade volumes and reliable delivery performance are two different things.
A country can import record quantities of goods while individual companies struggle with uncertain arrival dates, higher transportation expenses or changing port conditions.
Demand is only one part of the equation
Rising imports can indicate healthy consumer spending and business activity, but the reasons behind the increase matter.
Companies may bring goods forward to prepare for holiday demand. Others may be replenishing inventories after a period of caution. Some may be adjusting sourcing or routing strategies because of changes in trade costs.
These explanations are not mutually exclusive, and the aggregate import figures do not determine the contribution of each factor.
Businesses should therefore combine national import data with their own purchase orders, sales forecasts and supplier information before deciding whether to increase inventory.
Trade policy can change shipment timing
Tariffs and regulatory requirements can influence when importers place orders, how they select suppliers and which products they prioritize.
When companies anticipate higher duties or changes in trade rules, they may accelerate shipments. That can increase port activity in the short term without necessarily indicating an equivalent increase in final consumer demand.
Conversely, uncertainty can cause businesses to delay purchases while they wait for clearer cost information.
The October Descartes report identifies evolving tariff requirements as one of several factors affecting import planning. The figures do not establish that tariffs alone caused September’s record, however.
Importers should evaluate the rules applicable to each product, its country of origin and its customs classification rather than relying on broad assumptions about trade policy.
Port choice is becoming a more strategic decision
For many years, businesses treated port selection primarily as a freight procurement decision. Today, the calculation increasingly includes schedule reliability, inland transportation capacity, alternative routes and exposure to disruptions.
A West Coast port may offer advantages for cargo arriving from Asia, but those benefits depend on the final destination and available inland transport.
An East Coast gateway may make sense for a distribution center serving eastern markets, yet longer ocean routes or changing vessel schedules can alter the comparison.
Companies should periodically model multiple routing scenarios rather than assume that the port used last year will remain the best option.
Visibility is more valuable when conditions change
Shipment tracking becomes especially important when normal transit assumptions stop working.
A business that can identify a delayed vessel early has more time to communicate with suppliers, adjust production schedules, redirect eligible shipments or notify customers.
Without timely information, the same delay may remain unnoticed until inventory is already running low.
This is why supply chain visibility should extend beyond a tracking number. Businesses need information about purchase orders, vessel schedules, customs clearance, port milestones, inland transport and warehouse receiving capacity.
Broader Implications: What Record U.S. Container Imports Mean for American Businesses
Retailers face a difficult holiday inventory balance
The fourth quarter is a critical period for retailers, particularly those selling seasonal products, electronics, toys, clothing and household goods.
Strong imports may support inventory availability, but delayed arrivals can create gaps between planned and actual stock levels.
Ordering more inventory can provide a buffer, yet it also ties up cash and increases storage costs. Ordering too little risks stockouts and lost sales.
Retailers should use product-level demand forecasts and realistic lead times to decide which goods need additional protection. High-margin or difficult-to-replace items may justify different inventory policies from products with flexible sourcing options.
Manufacturers need to protect production schedules
Manufacturers importing machinery, components and raw materials can face a different problem from retailers.
A delayed shipment of one essential component may prevent an entire production line from operating at planned capacity.
The cost of such a disruption can exceed the freight expense itself, especially when it affects delivery commitments to customers.
Manufacturers should identify components with long replenishment times, limited supplier alternatives or high consequences if unavailable. Those items may require additional safety stock, alternate sourcing or closer coordination with suppliers.
Procurement teams need a broader view of total cost
Ocean freight is only one part of the cost of moving imported goods.
Businesses must also consider port handling, customs brokerage, duties, inland transportation, storage, insurance and the working capital tied up while inventory is in transit.
A route with a lower quoted freight rate may not be the most economical option if it has longer or less predictable transit times.
Procurement teams should compare total landed cost and delivery reliability across viable alternatives, then revisit those comparisons when market conditions change.
Supply chain resilience can protect revenue
Resilience does not mean eliminating every possible disruption. It means designing operations so that a disruption is less likely to cause an outsized business impact.
That may involve more than one qualified supplier, alternative port options, flexible carrier contracts, better inventory visibility or contingency plans for critical products.
The right combination depends on the company’s size, product mix, margins and customer commitments.
For The Tech Marketer, a relevant internal linking opportunity would be a related article about AI-driven supply chain visibility or inventory forecasting. Link to an existing, relevant article on the site if available; otherwise, treat it as a proposed future article rather than an existing published page.
Related History and Comparable Trends
Lessons from pandemic-era port congestion
The COVID-19 pandemic showed how quickly disruptions at major ports can spread through global supply chains.
During that period, strong consumer demand, shipping capacity constraints and operational bottlenecks contributed to long waits and elevated transportation costs.
The September 2026 situation should not automatically be described as a repeat of that crisis. The latest data shows increased transit delays at several gateways, but it does not establish that the entire U.S. port system is experiencing the same kind of systemic congestion seen during the pandemic.
The historical comparison is useful because it demonstrates how small disruptions can become more consequential when inventories are lean and many companies rely on the same transportation routes.
Importers continue to adapt their sourcing strategies
The past several years have encouraged companies to reassess their dependence on individual countries and suppliers.
Some have diversified production across multiple Asian economies. Others have considered nearshoring, reshoring or using different ports to serve particular regions.
Yet sourcing decisions take time. Supplier qualification, product testing, factory capacity and contractual commitments can make immediate changes impractical.
The rise in China-origin imports during September illustrates that supply chain diversification is not necessarily a straight-line process. Businesses may diversify selected products while continuing to source other goods from established Chinese suppliers.
Shipping route disruptions can reshape port activity
Global shipping patterns are influenced by canal capacity, maritime security, vessel schedules, freight costs and carrier decisions.
The October Descartes report discusses several changing conditions, including Middle East maritime incidents, additional carrier fuel charges and a partial restoration of Panama Canal transit capacity.
These developments can affect routing decisions, but their impact varies by trade lane and service.
Importers should monitor the routes used by their own suppliers instead of assuming that a disruption in one region will affect every shipment equally.
What Happens Next: Five Supply Chain Trends to Watch
1. October import volumes
The next monthly report will show whether September’s record was followed by sustained import activity or a seasonal slowdown.
Businesses should compare October figures with both the previous month and the same month in earlier years to avoid confusing seasonal movements with structural changes.
2. Port transit delays
The next Descartes updates will help determine whether the September increase in delays continues, stabilizes or reverses.
Importers should pay particular attention to gateways that serve their own suppliers and distribution centers.
3. China-origin import trends
September’s 21.2% year-over-year increase in China-origin imports is a useful indicator to monitor.
Future data may reveal whether the rise continues or whether sourcing patterns change again in response to demand, tariffs and shipping conditions.
4. Freight rates and carrier capacity
Businesses should monitor ocean freight quotations, fuel charges, vessel schedules and inland transportation capacity.
A rise in import volume does not automatically mean freight rates will increase. Rates also depend on available capacity, carrier pricing decisions and the balance between supply and demand.
5. Holiday inventory performance
Retailers should evaluate whether shipments arrive early enough to support planned sales periods.
Tracking purchase orders against actual receipt dates can help businesses identify which suppliers, routes and products create the greatest risk to holiday availability.
Conclusion
U.S. container imports reached their highest September volume on record in 2026, providing a strong indication that American maritime trade remains active despite a volatile global environment.
Descartes recorded 2.55 million TEUs of imports in September, 10.3% above the same month in 2025. China-origin shipments rose sharply, West Coast gateways gained share, and eight of the ten major ports tracked experienced higher transit delays.
The figures point to an important distinction for businesses. Strong import volumes can support growth, but they do not guarantee predictable delivery schedules or low logistics costs.
Retailers, manufacturers and procurement teams should use the latest data to review inventory policies, reassess routing options and strengthen shipment visibility ahead of the holiday period.
The companies best prepared for the months ahead will be those that connect national trade indicators with their own operational data. That means understanding not only how much cargo is entering the United States, but also where it is arriving, how long it takes to reach its destination and what happens if a critical shipment is delayed.
In an increasingly complex global trading environment, visibility and flexibility may prove just as valuable as access to shipping capacity.
Frequently Asked Questions
1. What are U.S. container imports?
U.S. container imports are goods brought into the United States in standardized shipping containers, commonly measured in twenty-foot equivalent units. They include products ranging from electronics and furniture to clothing, toys and industrial components.
2. Why did U.S. container imports hit a September record in 2026?
Descartes reported that U.S. imports reached 2,546,261 TEUs in September 2026, up 10.3% year over year. Strong import activity can reflect demand, inventory replenishment and sourcing decisions, but the aggregate data does not establish one single cause for the record.
3. Which countries contributed to the increase in U.S. container imports?
China was a major contributor. Imports from China reached 924,454 TEUs in September, up 21.2% compared with September 2025. Other countries also contributed to the overall trade picture, and changes varied across individual origins.
4. Why are U.S. port transit delays increasing?
Port transit delays can be influenced by shipping schedules, vessel arrivals, terminal operations, customs processing and changing trade routes. Descartes reported increases at eight of the ten major gateways it tracked in September 2026, but the figures do not establish one universal cause for every port.
5. Which U.S. ports experienced the largest increase in delays?
New York and New Jersey recorded the largest increase, with average transit delays rising 1.5 days to 8.3 days. Houston’s delays rose 1.4 days to 7.2 days. Seattle was the only gateway in the group to improve, with delays falling by one day to 6.5 days.
6. How can businesses prepare for shipping delays?
Businesses can improve shipment visibility, monitor supplier lead times, maintain appropriate safety stock for critical products, evaluate alternate ports and carriers, and establish contingency plans for delayed shipments.
7. Do record container imports mean the U.S. economy is growing faster?
Not necessarily. Import volumes provide useful information about goods movement and business activity, but they are not a complete measure of economic growth. Imports can rise because of demand, inventory rebuilding or changes in sourcing and shipment timing.
8. What should supply chain managers monitor after September’s record imports?
Key indicators include monthly import volumes, port transit delays, freight rates, vessel schedules, China-origin shipments, tariff developments and actual supplier delivery performance. These measures help businesses determine whether current conditions require changes to inventory and routing plans.
Sources and References
- Descartes Systems Group: Descartes Releases October Global Shipping Report: U.S. Container Imports Reach Highest September Volume on Record, October 8, 2026. Primary source for import volumes, country-of-origin data, port shares and transit delays.
- American Journal of Transportation: Descartes Global Shipping Report: U.S. Container Imports Reach Highest September Volume on Record, October 2026. Industry coverage of the report’s principal findings.
- DC Velocity: U.S. Container Imports Reached Their Highest September on Record, October 13, 2026. Industry reporting on import volumes and the implications for transportation.
- Reuters: U.S. Ocean Container Imports Set New Record for September, Descartes Says, October 2026. Independent news coverage of the import record and China-origin shipment increase.
- Descartes Systems Group: Global Logistics Shipping Report Resource Center. Archive of monthly container import and shipping risk reports.